O que acontece quando podemos prever crimes antes que eles aconteçam?
 What if you could predict where a crime will take place before it occurred, even determining the time of the incident and the identity of the culprit in advance? Sounds a bit like science fiction, right? Social scientists have long believed that historical crime trends often influence future patterns.
The revolution in advanced machine learning is putting their theories to the test. A new generation of crime forecasting tools is about to dramatically change the nature of law enforcement – and our privacy – forever. And it is more important than ever that we shine a light on the algorithms driving these innovations.
Lessons from one of the world’s most crime-affected cities
While still early days, at least 60 police departments in US and European cities have rolled rolling-out crime forecasting systems – with mixed results. Researchers are struggling to make sense of the outcomes. One of the problems is that police don’t like sharing what they’re doing with the public. Another is that it is exceedingly difficult to unpack the algorithms they use since they are proprietary. We simply don’t know what’s inside the black box.
In order to better understand the potential of crime prediction, we recently designed an open-source crime prediction platform for a particularly crime-affected city, Rio de Janeiro. On average roughly 1,000 people are murdered annually in the sprawling metropolis of 6 million. That’s twice the number of people murdered in all of Canada, a country with six times the population. And the crime situation has worsened over the past few years, though is not as terrible as many believe.
In Rio de Janeiro, like most cities around the world, it is hard to get a clear reading of security and safety. Public statistics are in not easily accessible and there are often long delays before they are released. Making matters worse, when local news outlets also run crime stories, they typically lead with sensationalist headlines that do more to spread fear than offer insight. It’s hardly a surprise, then, that 81% of the locals believe they are at risk of being murdered.
As in many cities around the world, Rio’s residents suffer from a dangerous knowledge gap when it comes to assessing the risk of crime. For example, few residents know that murder rates are still 50% of what they were a decade back. There is a worrisome disconnect between how people perceive criminal violence and its actual prevalence. This fear of crime dramatically affects the day-to-day decisions made by many of the city’s dwellers, including whether or not to turn to private security, gated communities or firearms for personal defense.
What seismology tells us about predicting crime
The good news is that violent crime can be reversed, or at least partly avoided. In many cities, the spread of smartphones, social media and data literacy is provoking changes in situational awareness and behaviour. Services like Amazon’s rating systems, Facebook, Instagram, Snapchat, Telegram and Yelp are creating a culture where people now expect to have access to data on every conceivable product and service – and shun offerings where data is unavailable.
What’s more, improvements in advanced machine learning mean that it’s possible to create much more accurate and targeted analytics to analyse crime dynamics, even in complex cities such as like Rio de Janeiro. Crime forecasting is just one example of this. It is based on the expectation that crime is hyper-concentrated in specific places and contagious among certain kinds of people.
The underlying mathematical models for crime prediction can be traced to an unlikely source – seismology. Very generally, crime is analogous to earthquakes: built-in features of the environment strongly influence associated aftershocks. For example, crimes associated with a particular nightclub, apartment block, or street corner can influence the intensity and spread of future criminal activity.
Open-source crime data
We recently put crime forecasting to the test. But instead of making it available exclusively to the police – what’s commonly referred to as predictive policing – we made the technology available to the public. The Igarapé Institute partnered with ViaScience and Mosaico to build a platform called CrimeRadar. The tool is powered by algorithms that process more than 14 million official crime events going back to 2010. It is designed with user-friendliness in mind and uses the API from Google Maps. It’s also free.
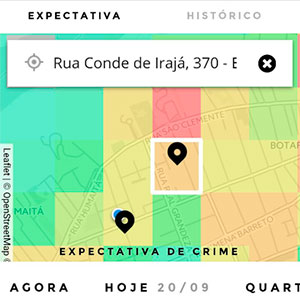
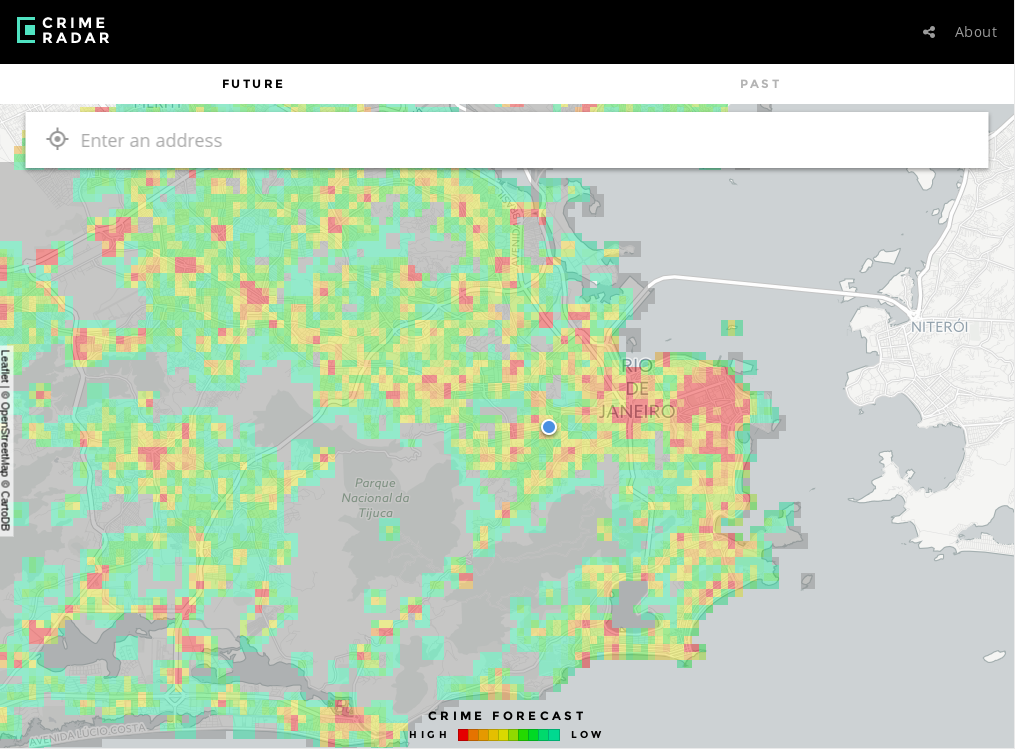
So how does it work in practice? If a user selects the “future” function then they will see an interactive and high-resolution map of metropolitan Rio de Janeiro. The colour scheme displays risk of crime ranging from green and yellow (lower probability) to orange and red (higher probability). Similar to a weather forecast, at the bottom of the screen are simple colour-coded icons displaying the times of day and days of the week, allowing users to check the risks in their actual location or future destination.
If users choose to explore the “past” function, they are shown a heat map of metropolitan Rio de Janeiro with the historical distribution of crime trends across the city. They can filter crime types – intentional homicide, police killing, violent assault and robbery leading to death – and different times of year. The app features data for the past 12 months and allows users to get a sense of what’s actually happened in their current locale or anywhere else in the city. It also confirms that roughly 80% of lethal violence is concentrated in less than 2% of the city’s street blocks.
Empowering citizens to protect themselves
This is the world’s first public-facing crime forecasting platform. CrimeRadar is designed specifically to empower citizens to better understand the crime risks they face and plan their routines accordingly. It expands transparency on public security, a taboo topic. It is an open source of information and speaks to the rights of citizens to information. CrimeRadar is also generating some waves, with mayors from Malmo to Quito expressing interest in setting up similar systems in their cities.
CrimeRadar shows users how crime is (unevenly) distributed in Rio de Janeiro. Surprisingly, victimization is not restricted to areas of concentrated disadvantage. There are several upper- and middle-income neighbourhoods exhibiting comparatively high risks of crime. The hope is that CrimeRadar can be applied by local businesses, politicians and activists to call for action to improve safety. Communities can use the tool to mobilize for change as well as to shape prevention strategies.
CrimeRadar also highlights the highly variable timing and seasonality of criminal incidents. After examining the past five years of crime data, it appears that most crime concentrates at 16.00 (and only late at night on Fridays and Saturdays). We also found that Mondays have the highest number of events and Sundays the lowest. There’s more. March sees the highest reported number of events and June is lowest. But the specifics also matter. Some neighbourhoods exhibit a forty-fold variation in reported crimes across a single week.
Crime waves with a silver lining
Mapping and reporting crime has consequences, both good and bad. The platform is designed to minimize the unintended consequences of making crime data more openly available, since this can potentially lead to over- or biased-policing of certain areas. For example, we provide data in 250 square meter blocks rather than at higher resolution. We have also stripped out personal information that could potentially compromise the anonymity of victims. Moreover, unreliable data – including information collected from chronically under-serviced areas – was also removed.
While still early days, the early reaction to crime radar has been quite positive. A survey of dozens of users shows that it has helped them make decisions about their personal mobility and personal life. We’ve also received some useful feedback to improve the tool, including adding new crime categories, more information on how the algorithm works, and more analysis of the long-term secular crime dynamics.
Just as important, the platform has triggered an important debate in cities across Brazil and elsewhere in Latin America, North America and Europe – including about ways to responsibly publicize crime data. While generating some important criticism, the platform is driving a much-needed public discussion about ways to improve the quality and coverage of crime data reporting in cities.
We see opportunities to empower citizens by forecasting crime in cities around the world. This is not just about improving personal security, but also the broader imperative to make data more open and available. The provision of public security in places like Brazil cannot rely on law enforcement alone; instead, it needs the support of an informed and active citizenry.
There is an ecosystem of new tools emerging in Rio de Janeiro – Amnesty’s Fogo Cruzado, Meu Rio’s Defezap, and even Waze’s new crime predicting tools are all examples. If there’s any silver lining to Rio’s crime wave, it’s that citizens are actively taking steps to make their city safer.
The path ahead
Whether we like it or not, predictive analytics are here to stay, and advances in processing power means that they will become more pervasive. They raise difficult ethical questions about the transparency of technologies, the interests of vendors, and the implications for policing and civil liberties. We cannot simply wish them away, but we can call for more openness about how algorithms are constructed.
Cities can and should invest in open source platforms to allow for more scrutiny and improvement of these programmes. In the end, the effectiveness of predictive tools depends not just on the quality of the algorithm, but also the data – forecasting is meaningless without trustworthy information. It’s also time to start thinking about establishing independent audits for both the algorithms and data, complete with compliance requirements, whistle-blower options, and protections of civil liberties.
Por Robert Muggah
Artigo de Opinião publicado em 02 de fevereiro de 2017
World Economic Forum


