

Where are the world’s most homicidal cities in 2023?
May 2024
Recent findings from the Homicide Monitor demonstrate that Latin American and Caribbean cities exhibit persistently high homicide rates compared to other regions.
Cities are powerful indicators of the progress of nations. When cities prosper, so do the prospects of countries. When they suffer from fragility, cities can experience deficits in everything from quality of life to investment to tourism. One critical measure of insecurity is lethal violence, including homicide. While hardly the only metric of safety and security, and in some cases not the most influential when it comes to public perception, lethal violence nevertheless provides a useful marker of the health of cities. Tracking changes in homicide can provide insight into progress on other fronts, including public security, governance and development.
While there are plenty of indices of liveable cities, there are only a handful that focus on monitoring urban violence. Part of the reason for this is the limited availability of standardized data on violence in cities. Fortunately, one of the world’s largest public repositories of intentional homicide, the Homicide Monitor, takes the pulse of cities with populations of at least 250,000 inhabitants. The latest update provides a sobering reminder of how murders concentrate not just at the national, but also the city-scale. Latin American and Caribbean cities continue to register among the highest levels of homicide in the world – both in terms of absolute numbers and prevalence – though trends there are also changing.
As in previous years, over 40 of the top 50 murderous cities in the world are located in the region. Cities reporting the highest homicide rates per 100,000 are found in Brazil (13), Mexico (11) and South Africa (6), the United States (7), Ecuador (5), Colombia (3), followed by Venezuela, Guatemala, Jamaica, Haiti, and Lesotho with one apiece (see Figure 1). Notwithstanding the continued clustering of Latin American and Caribbean cities at the top of the list, new cities have emerged while others have dropped off. These shifts in ranking are a result of organized crime dynamics and the outcomes of national and local public security interventions across the region.
At the top of the 2023 list is a surprising new entrant, Durán, an Ecuadorian city of roughly 305,000 people. Registering a homicide rate of 142.7 per 100,000, Duran has borne the brunt of the country’s rapidly escalating drug war involving rival Colombian, Mexican, and Albanian crime organizations. In fact, five Ecuadorian cities – Duran, Manta, Guayaquil, Machala and Portoviejo – are included in the top 10. Coming in second is the South African city of Nelson Mandela Bay, home to roughly 1.3 million residents in South Africa. Rounding out the top 20 are large and medium-sized cities located in Brazil, Colombia, Haiti, Jamaica, Mexico and South Africa, many of which come as little surprise.
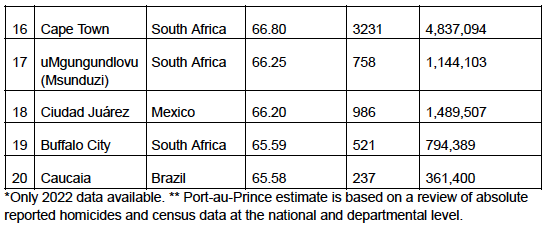
Figure 1. Top 20 most homicidal cities: 2020-2023 (homicide per 100,000)
| Rank | City | Country | Rate per 100,000 | Number | Population |
| 1 | Durán | Ecuador | 148.00 | 453 | 306,045 |
| 2 | Nelson Mandela Bay | South Africa | 102.82 | 1247 | 1,212,836 |
| 3 | Manta | Ecuador | 95.60 | 261 | 273,050 |
| 4 | Camaçari | Brazil | 90.93 | 272 | 299,132 |
| 5 | Cajeme | Mexico | 88.99 | 432 | 485,453 |
| 6 | Tijuana | Mexico | 87.88 | 1638 | 1,863,973 |
| 7 | Guayaquil | Ecuador | 83.80 | 2319 | 2,765,695 |
| 8 | Machala | Ecuador | 77.50 | 239 | 308,461 |
| 9 | eThekwini – Durban | South Africa | 76.89 | 3138 | 4,080,930 |
| 10 | Portoviejo | Ecuador | 76.00 | 247 | 325,193 |
| 11 | Feira de Santana | Brazil | 74.65 | 459 | 614,872 |
| 12 | Kingston | Jamaica | 70.73* | 475 | 671,596 |
| 13 | Celaya | Mexico | 68.07 | 370 | 543,570 |
| 14 | Macapá | Brazil | 67.75 | 341 | 503,327 |
| 15 | Port-au-Prince | Haiti | 67.20** | 827 | 1,231,788 |
| 16 | Cape Town | South Africa | 66.80 | 3231 | 4,837,094 |
| 17 | uMgungundlovu (Msunduzi) | South Africa | 66.25 | 758 | 1,144,103 |
| 18 | Ciudad Juárez | Mexico | 66.20 | 986 | 1,489,507 |
| 19 | Buffalo City | South Africa | 65.59 | 521 | 794,389 |
| 20 | Caucaia | Brazil | 65.58 | 237 | 361,400 |
*Only 2022 data available. ** Port-au-Prince estimate is based on a review of absolute reported homicides and census data at the national and departmental level
The explosion of lethal violence in Ecuadorian cities in 2023 is a tragedy foretold. In 2023, Durán had a homicide rate akin to other cities that graced the top spot including San Salvador in 2016 (174 per 100,000). Four other Ecuadorian cities also registered homicide rates exceeding 70 per 100,000 in 2023. Indeed, in 2022, three Ecuadorian cities had already crept into the top 50 most homicidal cities: Guayaquil (22 out of 50), Santo Domingo (33 out of 50), and Machala (36 out of 50). This is in stark contrast to the 2017-2021 period, however, when Brazilian, Colombia, Mexican, Venezuela and South African cities dominated the list. Conspicuously absent in 2023, however, are large Central American cities from El Salvador and Honduras that have featured prominently over the past decade.
The rising number of violent cities from South Africa, the United States, and Caribbean countries is also cause for concern. Alongside Nelson Mandela Bay with a homicide rate of 102 per 100,000 is eThekwini/Durban with a homicide rate 76.9 per 100,000 and four other cities – Cape Town, uMgungundlovu (Msunduzi), Buffalo City, and Johannesburg. Although homicides have decreased in several US cities in 2023, 7 still rank among the top 50 in the world: New Orleans, St. Louis, Baltimore, Cleveland, Detroit, Washington D.C., and Memphis (with the highest US murder rate in 2023). Meanwhile, Kingston (78 per 100,000) has figured among the upper echelons of the list over the past five years. Port-au-Prince, the capital of Haiti, joined the top 50 rankings for the first time, with a projected homicide rate of roughly 67 per 100,000 in 2023, three times the estimated rate in 2021.
To be sure, heavily populated countries stand a greater chance of having more cities included in the top 50 than smaller countries (see Figure 3). That said, the concentration of cities with high homicide rates from a relatively small number of nations is noteworthy. Consider Brazil, which has 13 cities included in the top 50 in 2023 compared to 29 cities in 2015. Likewise, Mexico features 11 cities in the top 50 in 2023 as opposed to just 3 in 2015. Ditto with South Africa (6) and the United States (7) which are featured in the top 50 in 2023 in contrast to just 1 and 2 respectively in 2015. Notably, cities from other countries with sizable populations – India, China, Indonesia, Nigeria, Pakistan, Bangladesh, Russia, Ethiopia, and Japan – did not make the list.
Figure 3. Countries featuring cities in the top 50 most homicidal (2015-2023)
| Country | 2023 | 2022 | 2021 | 2020 | 2019 | 2018 | 2017 | 2016 | 2015 |
| Bahamas | 0 | 0 | 0 | 0 | 0 | 0 | 0 | 0 | 1 |
| Brazil | 13 | 13 | 9 | 15 | 14 | 20 | 22 | 22 | 30 |
| Colombia | 3 | 2 | 4 | 2 | 2 | 2 | 2 | 2 | 3 |
| Ecuador | 5 | 4 | 0 | 0 | 0 | 0 | 0 | 0 | 0 |
| El Salvador | 0 | 0 | 1 | 1 | 1 | 1 | 3 | 3 | 3 |
| Guatemala | 1 | 1 | 1 | 0 | 2 | 2 | 2 | 2 | 3 |
| Haiti | 1 | 0 | 0 | 0 | 0 | 0 | 0 | 0 | 0 |
| Honduras | 0 | 1 | 2 | 2 | 2 | 1 | 1 | 3 | 3 |
| Jamaica | 1 | 1 | 1 | 1 | 1 | 1 | 1 | 0 | 0 |
| Lesotho | 1 | 1 | 1 | 1 | 0 | 0 | 0 | 0 | 0 |
| Mexico | 11 | 12 | 13 | 10 | 10 | 9 | 7 | 4 | 3 |
| Puerto Rico | 0 | 0 | 0 | 0 | 1 | 0 | 0 | 0 | 0 |
| South Africa | 6 | 5 | 5 | 4 | 5 | 2 | 1 | 2 | 1 |
| United States | 7 | 6 | 7 | 6 | 3 | 2 | 2 | 1 | 2 |
| Venezuela | 1 | 4 | 6 | 8 | 9 | 10 | 9 | 11 | 1 |
As noted in Figure 3, Latin America’s largest country, Brazil, featured the largest number of cities in the top 50 in 2023, albeit half the number almost a decade ago.1 Among the 13 Brazilian cities were 5 in the top 30. These include cities such as Camacari, Feira de Santana, and Salvador in the state of Bahia; Macapá in the Amazonian state of Amapá; and Caucaia in Ceará. While overall levels of homicide have decreased in Brazil in recent years, it is sharpening in parts of the Amazon and the northeast. Concerns with the “interioralization” of homicide have likewise grown, particularly among the nine states that make up the Legal Amazon which have murder rates that far exceed the national average.
Several cities in Latin America’s second largest country, Mexico, have consistently ranked among the top 10 since 2020 (see Figure 3). Cities such as Cajeme (Sonora), Tijuana (Baja California), and Celaya (Guanajuato) stand out. Indeed, Cajeme was the world’s most violent city in 2022-21, while Tijuana ranked first in 2018 and 2019, and second between 2020 to 2022. Other Mexican cities that made appearances have since dropped out the top 10 in recent years, including Ciudad Juárez (which had the highest rate in 2009), Salamanca (top 1 in 2020), Uruapan, Los Cabos, and Acapulco. Prior to 2017, Acapulco was the only Mexican city that entered the top 10 ranking.
Meanwhile, Colombia has registered between 2 and 4 cities in the top 50 since 2017 (see Figure 3). Yet Colombia has experienced unprecedented declines in homicidal violence over the past decade. Cities such as Medellín (Antioquia) and Cali (Valle del Cauca) were considered to be among the most violent in the world in the 1990s and 2000s. Yet most cities have dropped off the list with the exception of Cali that clings on stubbornly at 43 of 50 in 2023. Other intermediate cities entering the ranking last year are Sincelejo (top 29 in 2023 and the highest in Colombia) and Buenaventura (45 of 50). The presence of cities located in the Colombian Pacific stand out, including Tumaco, which ranked 6th in the world in 2022, and Buenaventura, which ranked 16th in 2021.
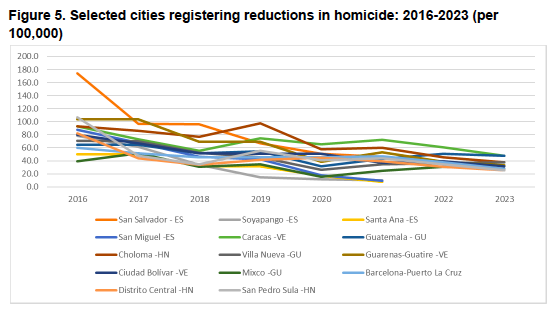
Arguably the biggest surprise in 2023 is the absence of several Central American cities from the the top 50 ranking (see Figure 3, Figure 4, and Figure 5). Cities such as San Salvador, San Miguel, and Soyapango in El Salvador were among the most homicidal cities in recent years. However, in the wake of controversial tough-on-crime crackdowns on violent gangs in El Salvador, lethal violence reportedly dropped by over 70 percent in 2023 alone. Meanwhile, the Honduran city of San Pedro Sula ranked as the most violent city in the world in 2014 with a homicide rate of 142 per 100,000. By 2023, the city had fallen outside the top 100 and registered a homicide rate of 25.8 per 100,000. Other cities such as the capital, Tegucigalpa, and Choloma also slipped off the top 50. By contrast, Guatemala City has experienced a recent increase in violent crime and reported a homicide rate of 47.8 per 100,000 in 2023.
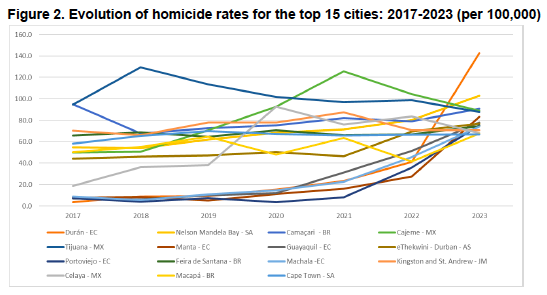
Figure 4. Ranking of most violent cities between 2017 and 2023 (homicides per 100,000)
| Country name | City name | 2023 | 2022 | 2021 | 2020 | 2019 | 2018 | 2017 |
| Ecuador | Durán | 1 | 50 | 124 | 189 | 301 | 301 | 437 |
| South Africa | Nelson Mandela Bay | 2 | 4 | 10 | 13 | 24 | 38 | 50 |
| Ecuador | Manta | 3 | 76 | 192 | 254 | 394 | 309 | 339 |
| Brazil | Camaçari | 4 | 5 | 5 | 11 | 11 | 18 | 8 |
| Mexico | Cajeme | 5 | 1 | 1 | 6 | 13 | 51 | 63 |
| Mexico | Tijuana | 6 | 2 | 2 | 2 | 1 | 1 | 9 |
| Ecuador | Guayaquil | 7 | 22 | 84 | 239 | 279 | 368 | 361 |
| Ecuador | Machala | 8 | 36 | 146 | 217 | 261 | 381 | 311 |
| South Africa | eThekwini – Durban | 9 | 11 | 36 | 32 | 41 | 59 | 78 |
| Ecuador | Portoviejo | 10 | 102 | 306 | 442 | 338 | 434 | 353 |
| Brazil | Feira de Santana | 11 | 13 | 12 | 12 | 19 | 17 | 32 |
| Jamaica | Kingston and St. Andrew | 12 | 8 | 3 | 10 | 8 | 22 | 23 |
| Mexico | Celaya | 13 | 3 | 7 | 5 | 68 | 91 | 177 |
| Brazil | Macapá | 14 | 39 | 15 | 39 | 20 | 35 | 61 |
| Haiti | Port-au-Prince | 15 | 90 | 138 | 592 | 657 | 125 | 134 |
| South Africa | Cape Town | 16 | 14 | 13 | 14 | 14 | 23 | 45 |
| South Africa | uMgungundlovu | 17 | 10 | 25 | 31 | 40 | 71 | 86 |
| Mexico | Ciudad Juárez | 18 | 16 | 4 | 4 | 5 | 15 | 76 |
| South Africa | Buffalo City | 19 | 21 | 48 | 53 | 44 | 73 | 72 |
| Brazil | Caucaia | 20 | 27 | 6 | 3 | 2 | 3 | 5 |
Another country with surprising reduction in highly violent cities is Venezuela (see Figure 3 and Figure 4). Only Caracas was included in the top 50 most homicidal cities in 2023, a sharp contrast from 2021 when 11 Venezuelan cities were featured in the list.
Local researchers associated with the Observatory of Violence in Venezuela attribute the apparent reduction in violent deaths to the limited opportunities for crime as well as an increase in the number of deaths “under investigation”. Even so, sudden and dramatic reductions in homicide – as noted in places like El Salvador, Honduras, and Venezuela – should be approached with caution. It is likely there are either changes in reporting methodologies or even regime changes which can result in the public availability and credibility of official sources.
Although the Homicide Monitor sheds light on city-scale trends, it suffers from several limitations, notably excluding cities with populations under 250,000. This exclusion results in the omission of small yet violent cities in Central America and the Caribbean. Importantly, there are many cities below the top 50 threshold and potentially below the population threshold that have experienced sharp increases in homicide rates. These cities are akin to ‘canaries in the mine,’ providing early warning signs of underlying shifts in the structure of organized crime. Examples include San José in Costa Rica which experienced a sharp increase in homicide from 15.1 per 100,000 in 2022 to 23 per 100,000 by 2023. Other cities registering increases are located in northern Chile and Rosario in Argentina. Likewise, a host of cities in Caribbean countries such as the Bahamas, Saint Kitts and Nevis, Saint Lucia, Saint Vincent and the Grenadines and Trinidad and Tobago all experienced sharp increases in recent years.
Another factor that frustrates comparative analysis of homicide in cities is that many countries in Africa and Asia simply do not generate or make available disaggregated city-level information. Even when requested by UNODC, national authorities are unable or unwilling to supply information on lethal and nonlethal violence at the subnational level. Data availability and quality is likewise uneven in both regions. For example, large
African cities with millions of inhabitants such as Kinshasa (DRC), Lagos (Nigeria), Cairo and Giza (Egypt), Luanda (Angola), Dar es Salaam (Tanzania), Khartoum (Sudan), and Abidjan (Côte d’Ivoire) simply lack basic official information or fail to report statistics on murder publicly. While it is unlikely that many cities in these regions register homicide rates exceeding the top 50 listed in 2023 (especially considering their comparatively low officially reported national homicide rates), the reality is that greater transparency and investment in data collection is needed.
It is also the case that countries and cities beset by wars and conflict often lack robust data collection on homicide. In Afghanistan, Myanmar, the Occupied Palestinian Territories, Sudan, Syria, and Ukraine, information on lethal violence is often gathered piecemeal from hospitals, humanitarian organizations, and media outlets. Another example is Haiti, which has been affected by an unprecedented crisis since 2021. The country experienced at least 4,789 homicides in 2023, more than double that of 2022. Using historical and disaggregated data, we estimate that the city’s homicide rate was roughly 67 per 100,000. Yet it is likely that even this rate underestimates the extent of homicidal violence, not least since there are extremely limited capacities in Haiti to even register fatalities. Ultimately, there are other data collection systems available to count conflict deaths, including from ACLED, Action on Armed Violence, and Uppsala University, each with differing methodologies and sources.
A focus on lethal violence in cities demonstrates homicide clusters in space. Indeed, an even more granular analysis would reveal the hyper-concentration of homicide at the neighborhood and even street corner scale. The focus on temporal changes in lethal violence also provides a potent reminder that it is not static and that city residents have agency. While a reflection on the top 50 most homicidal cities can help draw attention to the public security challenges confronting cities, it is important to recall that all urban centers face multiple forms of insecurity that warrant engagement and investment.
Annex 1. Top 50 most homicidal cities (2017-2023)
| Rank 2023 | Country name | City | 2017 | 2018 | 2019 | 2020 | 2021 | 2022 | 2023 |
| 1 | Ecuador | Durán | 3.8 | 9.0 | 9.1 | 15.5 | 23.3 | 39.8 | 148.0 |
| 2 | South Africa | Nelson Mandela Bay | 54.6 | 54.1 | 61.9 | 68.3 | 71.3 | 80.0 | 102.8 |
| 3 | Ecuador | Manta | 7.8 | 8.5 | 5.0 | 11.4 | 16.0 | 33.2 | 95.6 |
| 4 | Brazil | Camaçari | 95.0 | 67.8 | 72.5 | 75.3 | 82.1 | 79.0 | 90.9 |
| 5 | Mexico | Cajeme | 49.9 | 50.6 | 70.5 | 92.8 | 125.6 | 104.4 | 89.0 |
| 6 | Mexico | Tijuana | 94.7 | 129.4 | 113.4 | 101.9 | 97.0 | 98.9 | 87.9 |
| 7 | Ecuador | Guayaquil | 6.9 | 6.3 | 10.0 | 12.1 | 31.4 | 52.6 | 83.8 |
| 8 | Ecuador | Machala | 8.9 | 5.7 | 10.8 | 14.5 | 22.5 | 42.8 | 77.5 |
| 9 | South Africa | eThekwini – Durban | 44.1 | 46.2 | 47.0 | 50.4 | 46.5 | 69.7 | 76.9 |
| 10 | Ecuador | Portoviejo | 7.3 | 3.8 | 7.2 | 3.7 | 8.3 | 29.7 | 76.0 |
| 11 | Brazil | Feira de Santana | 65.7 | 68.9 | 64.7 | 70.5 | 66.3 | 66.9 | 74.6 |
| 12 | Jamaica | Kingston and St. Andrew | 70.3 | 66.3 | 77.9 | 78.0 | 87.3 | 70.7 | n.a |
| 13 | Mexico | Celaya | 18.6 | 36.1 | 38.0 | 92.9 | 76.0 | 83.4 | 68.1 |
| 14 | Brazil | Macapá | 50.3 | 55.3 | 64.6 | 47.8 | 63.6 | 41.4 | 67.7 |
| 15 | Haiti | Port-au-Prince | n.a | 26.7 | n.a | n.a | 22.7 | n.a | n.a |
| 16 | South Africa | Cape Town | 58.1 | 65.4 | 69.9 | 67.1 | 65.7 | 66.5 | 66.8 |
| 17 | South Africa | uMgungundlovu | 41.4 | 42.4 | 47.1 | 50.4 | 52.9 | 69.8 | 66.3 |
| 18 | Mexico | Ciudad Juárez | 44.7 | 69.4 | 88.0 | 97.4 | 82.7 | 58.7 | 66.2 |
| 19 | South Africa | Buffalo City | 46.3 | 42.1 | 46.1 | 42.3 | 41.8 | 54.2 | 65.6 |
| 20 | Brazil | Caucaia | 98.0 | 101.9 | 101.9 | 99.4 | 78.1 | 49.6 | 65.6 |
| 21 | United States of America | Memphis | 27.7 | 28.8 | 29.2 | 44.4 | 47.1 | 45.9 | 63.9 |
| 22 | Mexico | Salamanca | 28.7 | 97.9 | 101.8 | 107.4 | 51.7 | 58.0 | 63.1 |
| 23 | Mexico | Uruapan | 29.0 | 43.3 | 68.8 | 59.2 | 73.0 | 70.3 | 56.1 |
| 24 | Mexico | Acapulco de Juarez | 100.3 | 100.5 | 70.8 | 42.6 | 52.4 | 51.6 | 52.9 |
| 25 | United States of America | New Orleans | 39.5 | 37.1 | 30.7 | 51.0 | 53.3 | 71.0 | 52.2 |
| 26 | Brazil | Salvador | 51.6 | 43.4 | 37.6 | 47.8 | 55.5 | 54.8 | 52.1 |
| 27 | Lesotho | Maseru | n.a | n.a | n.a | 56.8 | 53.3 | 51.8 | n.a |
| 28 | Brazil | Petrolina | 38.2 | 41.9 | 27.2 | 37.5 | 34.5 | 39.3 | 51.0 |
| 29 | Colombia | Sincelejo | 16.9 | 14.4 | 15.7 | 13.9 | 25.5 | 27.6 | 50.3 |
| 30 | United States of America | St. Louis | 66.1 | 60.9 | 64.6 | 88.1 | 64.0 | 68.0 | 50.3 |
| 31 | Mexico | Cuernavaca | 20.2 | 26.2 | 42.4 | 34.5 | 43.0 | 42.4 | 50.0 |
| 32 | Venezuela | Caracas | 73.4 | 55.2 | 74.7 | 65.2 | 72.5 | 61.1 | 47.9 |
| 33 | Guatemala | Guatemala | 64.3 | 51.6 | 55.0 | 31.8 | 43.1 | 50.9 | 47.8 |
| 34 | Mexico | Chilpancingo | 94.2 | 89.5 | 50.7 | 31.7 | 23.1 | 32.0 | 47.4 |
| 35 | Brazil | Imperatriz | 45.2 | 49.6 | 43.7 | 44.3 | 41.2 | 37.5 | 47.2 |
| 36 | United States of America | Baltimore | 55.8 | 51.0 | 58.3 | 51.5 | 54.0 | 58.0 | 46.0 |
| 37 | United States of America | Cleveland | 27.8 | 22.4 | 24.1 | 42.2 | 43.5 | 45.7 | 45.7 |
| 38 | Mexico | León | 20.6 | 21.3 | 27.4 | 37.7 | 41.8 | 36.1 | 45.2 |
| 39 | Brazil | Olinda | 42.0 | 40.8 | 38.0 | 33.8 | 33.3 | 34.6 | 44.8 |
| 40 | Brazil | Marabá | 76.2 | 73.8 | 51.9 | 33.9 | 39.6 | 47.2 | 44.4 |
| 41 | Brazil | Jaboatão dos Guararapes | 58.6 | 45.9 | 42.6 | 46.8 | 39.5 | 40.7 | 43.9 |
| 42 | Brazil | Manaus | 49.4 | 47.2 | 46.0 | 35.9 | 53.6 | 46.8 | 43.8 |
| 43 | Colombia | Cali | 56.0 | 51.7 | 49.7 | 47.7 | 54.0 | 43.1 | 43.7 |
| 44 | Brazil | Palmas | 22.7 | 26.0 | 30.8 | 33.6 | 24.6 | 31.7 | 42.8 |
| 45 | Colombia | Buenaventura | 22.3 | 29.5 | 36.4 | 35.6 | 61.6 | 34.8 | 42.8 |
| 46 | South Africa | Johannesburgo | 29.2 | 30.7 | 31.7 | 32.1 | 27.4 | 35.8 | 42.7 |
| 47 | Brazil | Maceió | 64.4 | 51.7 | 34.1 | 30.2 | 32.0 | 37.3 | 41.8 |
| 48 | United States of America | Detroit | 39.5 | 39.2 | 41.5 | 49.7 | 45.0 | 50.0 | 40.6 |
| 49 | Mexico | Juarez | 10.3 | 18.2 | 25.1 | 25.4 | 19.9 | 29.9 | 39.8 |
| 50 | United States of America | Washington DC | 16.7 | 22.7 | 23.4 | 27.8 | 31.8 | 28.4 | 39.1 |
Annex 2. Sources of data for the top 50 most homicidal cities 2023
| Rank | Country | City | Rate per 100,000 | Number | Population | Source |
| 1 | Ecuador | Durán | 148.00 | 453 | 306,045 | Ministerio del Interior/DINASED |
| 2 | South Africa | Nelson Mandela Bay | 102.82 | 1247 | 1,212,836 | South African Police Service |
| 3 | Ecuador | Manta | 95.60 | 261 | 273,050 | Ministerio del Interior/DINASED |
| 4 | Brazil | Camaçari | 90.93 | 272 | 299,132 | Compiled from Secretaries of Security |
| 5 | Mexico | Cajeme | 88.99 | 432 | 485,453 | SESNSP -Secretariado del Ejecutivo del Sistema Nacional de Seguridad Pública |
| 6 | Mexico | Tijuana | 87.88 | 1638 | 1,863,973 | SESNSP -Secretariado del Ejecutivo del Sistema Nacional de Seguridad Pública |
| 7 | Ecuador | Guayaquil | 83.80 | 2319 | 2,765,695 | Ministerio del Interior/DINASED |
| 8 | Ecuador | Machala | 77.50 | 239 | 308,461 | Ministerio del Interior/DINASED |
| 9 | South Africa | eThekwini – Durban | 76.89 | 3138 | 4,080,930 | South African Police Service |
| 10 | Ecuador | Portoviejo | 76.00 | 247 | 325,193 | Ministerio del Interior/DINASED |
| 11 | Brazil | Feira de Santana | 74.65 | 459 | 614,872 | Compiled from Secretaries of Security |
| 12 | Jamaica | Kingston and St. Andrew | 70.73 | 475 | 671,596 | Jamaica Constabulary Police Force (2022) |
| 13 | Mexico | Celaya | 68.07 | 370 | 543,570 | SESNSP -Secretariado del Ejecutivo del Sistema Nacional de Seguridad Pública |
| 14 | Brazil | Macapá | 67.75 | 341 | 503,327 | Compiled from Secretaries of Security |
| 15 | Haiti | Port-au-Prince | 67.20 | 827 | 1,231,788 | Projections based on departmental data |
| 16 | South Africa | Cape Town | 66.80 | 3231 | 4,837,094 | South African Police Service |
| 17 | South Africa | uMgungundlovu | 66.25 | 758 | 1,144,103 | South African Police Service |
| 18 | Mexico | Ciudad Juárez | 66.20 | 986 | 1,489,507 | SESNSP -Secretariado del Ejecutivo del Sistema Nacional de Seguridad Pública |
| 19 | South Africa | Buffalo City | 65.59 | 521 | 794,389 | South African Police Service |
| 20 | Brazil | Caucaia | 65.58 | 237 | 361,400 | Compiled from Secretaries of Security |
| 21 | United States of America | Memphis | 63.90 | 397 | 621,056 | Police office |
| 22 | Mexico | Salamanca | 63.12 | 190 | 300,994 | SESNSP -Secretariado del Ejecutivo del Sistema Nacional de Seguridad Pública |
| 23 | Mexico | Uruapan | 56.06 | 203 | 362,116 | SESNSP -Secretariado del Ejecutivo del Sistema Nacional de Seguridad Pública |
| 24 | Mexico | Acapulco de Juarez | 52.91 | 449 | 848,647 | SESNSP -Secretariado del Ejecutivo del Sistema Nacional de Seguridad Pública |
| 25 | United States of America | New Orleans | 52.20 | 193 | 369,749 | Police office |
| 26 | Brazil | Salvador | 52.08 | 1496 | 2,872,347 | Compiled from Secretaries of Security |
| 27 | Lesotho | Maseru | 51.79 | 181 | 350,000 | Lesotho Bureau of Statistics (data 2022) |
| 28 | Brazil | Petrolina | 50.98 | 178 | 349,145 | Compiled from Secretaries of Security |
| 29 | Colombia | Sincelejo | 50.32 | 153 | 304,026 | Policía Nacional |
| 30 | United States of America | St. Louis | 50.25 | 518 | 314,428 | Police office |
| 31 | Mexico | Cuernavaca | 50.02 | 205 | 409,831 | SESNSP -Secretariado del Ejecutivo del Sistema Nacional de Seguridad Pública |
| 32 | Venezuela | Caracas | 47.91 | 1284 | 2,680,297 | Observatorio Venezolano de la Violencia |
| 33 | Guatemala | Guatemala | 47.80 | 584 | 1,221,739 | Policía Nacional Civil |
| 34 | Mexico | Chilpancingo De Los Bravo | 47.40 | 137 | 289,043 | SESNSP -Secretariado del Ejecutivo del Sistema Nacional de Seguridad Pública |
| 35 | Brazil | Imperatriz | 47.16 | 122 | 258,682 | Compiled from Secretaries of Security |
| 36 | United States of America | Baltimore | 46.00 | 262 | 569,931 | Police office |
| 37 | United States of America | Cleveland | 45.70 | 168 | 367,615 | Police office |
| 38 | Mexico | León | 45.15 | 777 | 1,720,754 | SESNSP -Secretariado del Ejecutivo del Sistema Nacional de Seguridad Pública |
| 39 | Brazil | Olinda | 44.84 | 176 | 392,482 | Compiled from Secretaries of Security |
| 40 | Brazil | Marabá | 44.39 | 124 | 279,349 | Compiled from Secretaries of Security |
| 41 | Brazil | Jaboatão dos Guararapes | 43.86 | 308 | 702,298 | Compiled from Secretaries of Security |
| 42 | Brazil | Manaus | 43.84 | 957 | 2,182,763 | Compiled from Secretaries of Security |
| 43 | Colombia | Cali | 43.75 | 1005 | 2,297,230 | Policía Nacional |
| 44 | Brazil | Palmas | 42.79 | 128 | 299,127 | Compiled from Secretaries of Security |
| 45 | Colombia | Buenaventura | 42.77 | 136 | 318,003 | Policía Nacional |
| 46 | South Africa | Johannesburg | 42.66 | 2656 | 6,225,275 | South African Police Service |
| 47 | Brazil | Maceió | 41.81 | 426 | 1,018,948 | Compiled from Secretaries of Security |
| 48 | United States of America | Detroit | 40.60 | 252 | 620,376 | Police office |
| 49 | Mexico | Juarez | 39.83 | 168 | 421,798 | SESNSP -Secretariado del Ejecutivo del Sistema Nacional de Seguridad Pública |
| 50 | United States of America | Washington DC | 39.05 | 274 | 701,665 | Police office |
