

22 de May de 2017
In
International, Earth Timelapse in the news
Startling maps show every terrorist attack worldwide for the last 20 years
May, 2017
In the US, your risk of death due to terrorism is roughly 1 in 46,000.
Around the world, that rate can vary wildly. In an attempt to visualize those global risks, Carnegie Mellon researchers teamed up with Robert Muggah, a global security expert and director of the think tank Igarapé Institute.
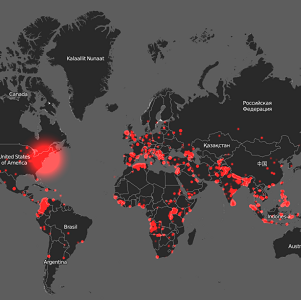
Together, they created Earth TimeLapse, an interactive platform that relies on data from the Global Terrorism Database to create maps of how many terrorism-related deaths occur annually worldwide. The larger the red circle, the more deaths in a given attack.
Here’s what the last 20 years of that data looks like.
To access the full story, click here.