

What makes a city ‘fragile’?
There’s a lot of talk in cities today about building “resilience” against disasters, social strife and economic shocks. But the flip side of that quest is to understand what makes cities fragile in the first place.
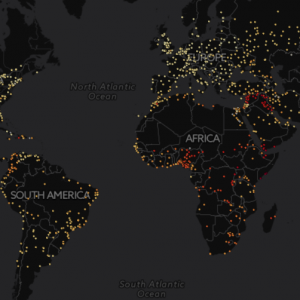
That’s the idea behind the Fragile Cities Data Visualization, a project launched recently by the Igarapé Institute, United Nations University, World Economic Forum and 100 Resilient Cities initiative. The tool generates a fragility “score” for 2,100 cities around the globe, based on data on population growth, air pollution, terrorist killings and other metrics. Those scores, along with the data underlying them, are available here in an interactive map.
I spoke with Robert Muggah, research director at the Igarapé Institute, to find out more about this data tool and how it attempts to measure fragility in cities. This interview has been edited for length and clarity.
Gabriela Rico: How would you define ‘fragility’ when it comes to cities?
Robert Muggah: It’s the inability of city-based institutions to deliver basic conditions of livability. That can be expressed by higher or unusual rates of violence, a more-dramatic-than-usual exposure to disaster risk, or spiraling inequality, or as a lower rate of penetration of electricity. There are multiple risks that cities around the world face. And fragility was a useful analytical framework to understand the aggregation of urban risks across a wide spectrum of social, economic, environmental, and climactic areas.
Q: Why is ‘fragility’ important to measure?
A: The ‘why’ is motivated by a number of factors. First, cities are increasingly the reference for a wide range of activities relating to development and responding to climate change and dealing with issues of international security. Cities are becoming the dominant actor in shaping global action. Cities are forging networks and creating linkages between each other and creating confederations. There has been an absence of underlying information to help support cities in these efforts. That information is especially limited in those places of the world where cities are growing fastest — in Africa and Asia.
It is important to have a wide spectrum of metrics because that’s how we talk about cities — we talk about how to improve living conditions and the quality of life in cities. We have a whole group of people talking about ‘smart’ cities. We have a group of people talking about ‘green’ cities. We have people who talk about the crime in cities and public security in cities. We very seldom have people looking at the entirety of what is going on in cities. So we literally and figuratively want to get people on the same page with this visualization.
Q: How does the Fragile Cities Data Visualization measure fragility?
A: We came up with shortlist of 11 metrics which have two criterions. One is that there has to be a relatively evidence-based relationship expressed in literature between said metric and volatility of cities. The other thing is the availability of data related to that indicator.
We wanted to look at the outcome variables and the outcome measures of institutional performance. Which we proxied as being rates of violence, levels of conflict, exposure to terrorist attacks, exposure to fatalities due to disaster, etc.

What we’re not doing is measuring the performance of institutions per se. We’re not measuring access to health or access to education in cities. The reason we don’t do that is because we think that may not capture the overall performance of cities. You can still have relatively high levels of access to services, but in terms of the outcome, it might still be terrible. In Brazil, for example, you have great access to schools but the outcome is still very low rates of literacy.
In addition to that, we felt it was impossible to get those measures for a large sample of cities. So while even if there might be an empirical relationship, for the vast number of cities around the world we wouldn’t necessarily find institutional performance measured on a micro-level scale.
Q: How does ‘fragility’ of cities relate to the discussion going on in cities today about ‘resilience’?
A: We initially thought that we could think about cities as being either fragile or resilient. But the more we looked into the concept, the more we recognized that fragility is really something dynamic. It’s not that you go from fragility to resilience and resilience to fragility, necessarily. You can have a city that expresses fragility in terms of homicide rates and inequality, but shows aspects of resilience in terms of disaster preparedness, in terms of its investment in building codes that prevent exposure, in terms of reinforcing buildings so that they are able to withstand sudden stresses of climate. There are many cities that to some extent exhibited fragility and resilience simultaneously. They are two complementary concepts.
Q: What themes and patterns did you observe in the data?
A: It varied region to region. We know that in Latin America, social-conflict variables and inequality seemed to be common drivers across cities that contributed to fragility, especially in Central America. In parts of Africa, things like social conflict, population growth, air pollution, and access to energy were the kinds of things that seemed to be factors across cities contributing to their fragility. In Asia, air pollution, exposure to disaster and climate risks, and again population growth — those were some of the factors that contributed to fragility. So that was interesting to us. Within each region there was sort of a common set of factors that shaped fragility locally.
Q: Western Europe had no cities that were classified as ‘highly fragile.’ What were the common characteristics among those countries that led to more stability in the region as a whole?
A: Very very low levels of violence — homicide and social conflict. They had relatively low risks of drought or floods or cyclones compared to other regions. The inequality levels were very low compared to other places. None of the countries were in a conflict or fragile situation. It’s really about security and climate risk and inequality being very low compared to Latin America or Africa or Asia.
Q: Are there any changes you plan on making for future versions of the platform?
A: We want to allow people to look backward and forward. What we are now doing is building in data from the past — we are going back to 2000. We are also getting the most recent data possible. And then what we’ll do is we’ll build out projections for the next 15 years. So we’ll have 15 years back in time and then we’re going to be projecting until 2030 — sort of modeling out the future of risks.

We’re also adding some new ‘filters’ or data points. We’ve been working with groups to add a sea-level rise filter, which is really an amalgam of actual projected sea-level rise together with elevation of cities. We’ll be merging our data set with Carnegie Mellon University’s work on climate change so that we’ll be able to look at both fragility and risk in cities and also look at changes in climate to see if there are any associations. We’ll be launching that in January 2017.
Q: Were you surprised by anything as you were developing this project?
A: What I was surprised by was when we scraped the surface, just how little real information we have about the health and wellbeing and welfare of cities and the residents within them. The process of developing the dataset and then ultimately establishing the visualization was very revealing as a process.
The second surprise was that the empirical data seems to match the theory. This was in a way an experiment. We selected these specific metrics based on a set of theoretical criteria that we thought was scientifically informed. When you actually start looking at the distribution of the fragility score, what we were struck by was how much it conformed to reality by many standards.
The third surprise was that fragility is not confined to cities of low-income areas, as one might expect. In fact, there are many cities in low-income areas that don’t have a high fragility score. We expected almost all fragile cities to be in countries dealing with high levels of crime and poverty, but that wasn’t the case. There is an incredibly wide distribution of fragility across low-, medium- and high-income settings, even if we had concentrations in the low-income bandwidth.
The number of cities in the medium-fragile bandwidth that were in Europe and North America, suggests that complacency about our cities, even in areas that are extraordinarily prosperous, would be an error.