

How fragile are our cities?
The world is urbanizing at a breakneck pace. But not all regions are moving at the same speed. Most population growth today and tomorrow will occur in the sprawling cities and slums of Africa and Asia. Just three countries — China, India and Nigeria — will account for 40% of global growth over the next decade. Meanwhile, many cities in North America and Western Europe are actually shrinking.
The pace of this urban revolution is mesmerizing. Just 3% of the world’s population lived in cities in the early 1800s, compared to over 50% today. Yet future urbanization will take place not only in megacities, but in small and medium-sized cities of the Global South. There are tremendous opportunities in these fast-growing settings, but also unsettling risks. Some cities are especially susceptible to insecurity.
All cities are fragile. The intensity of their fragility, however, varies considerably across time and space. Some cities – Aleppo, Caracas, Kabul, or Mogadishu – are affected by acute fragility and are close to collapse. Others – Abuja, Baltimore, Dhaka, and San Salvador – are also at risk, albeit to a lesser degree. Even cities like Amsterdam, London, New York, Paris, and Tokyo are not immune.
Fragility occurs when city authorities are unable or unwilling to deliver basic services to citizens. It is triggered by a rupture of a city’s social contract. So what tips cities over? The intensity of fragility is conditioned by an accumulation of risks. And some risks – the pace of urbanization, income and social inequality, youth unemployment, homicidal and criminal violence, poor access to key services, and exposure to climate threats – are more serious than others.
Which cities are most fragile? This straight-forward question is surprisingly hard to answer. Part of the problem is that there is no agreed definitionof what constitutes a city. More fundamentally, there is a shocking paucity of data on the vast majority of the world’s cities. While there are dozens of think tanks and private firms that claim to gather data on cities, their geographic coverage is surprisingly thin.
Today’s debate on cities is limited to the world’s 30-odd megacities and the 600 cities driving international economic growth. They’ve expanded with dizzying speed: these cities constitute a new layer of global governance. Yet there is virtually no discussion about what is happening in theother roughly 3,400 cities with over 100,000 residents. And there is a veritable silence about the other 50,000 cities and urban localities around the world. This is worrying because it is cities whose names you’ve never heard of that will shape the future.
In order to start filling some of these knowledge gaps, the Igarapé Instituteteamed up with the United Nations University, the World Economic Forum, theWorld Bank and SecDev, with support from the Canadian government, to hone in on the correlates of city fragility. We first focused on isolating the drivers, or risks, that make some cities more fragile than others. Next, we started mapping out the geography of urban fragility, consulting with dozens of specialists and scouring over 100 databases to answer some rudimentary questions. One of our outputs is a data visualization.

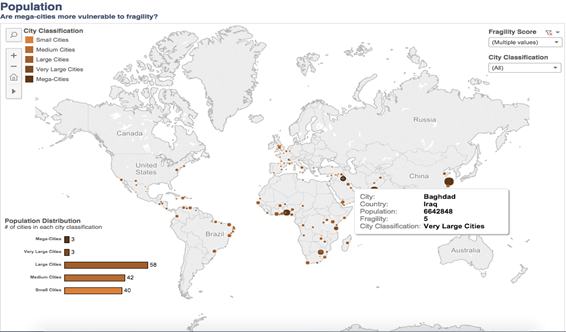
The fragile cities data visualization is a platform that tracks risks in over 2,137 cities with populations of 250,000 people or more. It includes a fragility scale (from 1-5, with 1 being low risk of fragility and 5 representing high risk). The scale is based on ten indicators that are statistically associated with instability. The idea is to provide mayors, planners, business people, and civil society groups access to annualized data on the ways in which urban fragility is distributed in upper-, middle- and lower-income settings. The early findings teach us a few lessons.
First, city fragility does not appear to be restricted to poor developing countries. There are of course clusters of chronically fragile cities in sub-Saharan Africa and Central, South and Southeast Asia, especially in Afghanistan, Bangladesh and Pakistan as well as the Democratic Republic of the Congo, Nigeria and South Africa. The data visualization suggests that there are at least as many cities ranking high on the fragility scale (scoring at least 4 or 5) in high and upper-middle income settings (n: 84) as in lower-middle and low incomes ones (n: 62).

Second, fragile cities are not confined to countries wracked by armed conflict. There were roughly 40 war-affected and 33 fragile states in 2015. There is little doubt that cities in countries such as Iraq, South Sudan or Syria are especially at risks of instability. But cities in these countries are not the only ones at high risk. In fact there were twice as many at risk cities (4-5 on the fragility scale) outside of war zones (n: 111) then in them (n: 35). What is more, there were almost five times more fragile cities outside of so-called “fragile states” (n:122) then in them (n: 24).

Third, it is not necessarily the largest cities that are most susceptible to fragility. Rather, it is smaller- and medium-sized cities that are most at risk. The data visualization demonstrates that just three megacities (over 10 million people) and three very large cities (with between 5 and 10 million people) are at high risk of fragility (4-5 on the scale). These include Baghdad, Dar es Salaam, Johannesburg, Karachi, Lagos and Shanghai. But there are another 56 large cities (1-5 million people), 42 medium cities (500,000-1 million people) and 40 smaller cities (250,000-500,000 people) that are classified as “fragile”.
Fourth, the fastest growing cities appear to be especially vulnerable to fragility. Most cities around the world are growing at between 0-3%. The data visualization detects 87 cities – most of them in the rust belt of the United States, in the United Kingdom, France, Germany, Russia and Ukraine, and parts of China – that are shrinking in size. Yet the most at-risk cities are those that are growing at a pace of 4% or more. The risks are especially prominent in sub-Saharan Africa, the Middle East and South and East Asia where the vast majority of future city population growth is projected.

Fifth, the most violent cities in the world are not where you think they are. While some research organizations rank cities according to homicide, their assessments are often heavily biased due to variation in reporting rates. The fragile cities data visualization tracks both homicide and reported incidents of violence from a review of over a thousand media outlets. While homicide is highly clustered in Latin American and Caribbean cities, reported violence is more widely distributed in North and Central American, sub-Saharan African, Middle Eastern, and South Asian urban centres.

The future of global security and development will be determined by our cities. Yet we know alarmingly little about what is going on in them. This is especially worrying given the focus of the freshly minted Sustainable Development Goals on making cities more inclusive, safe and resilient. The fragile cities data visualization offers an important new layer of understanding. But it also has major gaps. While it includes basic demographic information on all cities registering more than 250,000 people, is still lacks sufficient data to render a fragility score for almost half of them (1,046 cities). Our team is working to plug these data holes, but it is not easy.
The good news is that city fragility is not permanent. There are remarkable examples of once dangerous cities turning things around. How do they do this? They start with enlightened leadership, especially successive mayors that make a plan and stick to it. The best cases involve evidence-based and targeted approaches to mitigating risks. Cities that purposefully build inclusive public spaces, support predictable transport, invest in hot-spot policing, create meaningful opportunities for young people, and plan carefully to mitigate natural disasters are the most likely to shift from fragility to resilience.
By Robert Muggah, research director of the Igarapé Institute
Opinion editorial published in 9 February 2016
World Economic Forum
The author would like to give credit to Katherine Aguirre, researcher at the Igarapé Institute, for her support in developing the fragile cities data visualization.